In the competitive world of Google Ads, it’s not enough to optimize keywords, refine ad copy, and adjust bids — you also need to understand how your ads are performing compared to your competitors. That’s where the Google Ads Auction Insights report becomes an essential tool in your PPC strategy.
Often overlooked, this report offers unmatched transparency into the Google Ads auction system. It shows whether you’re appearing in the right auctions, reveals who your true competitors are, and provides the data you need to make smarter bidding, targeting, and budgeting decisions.
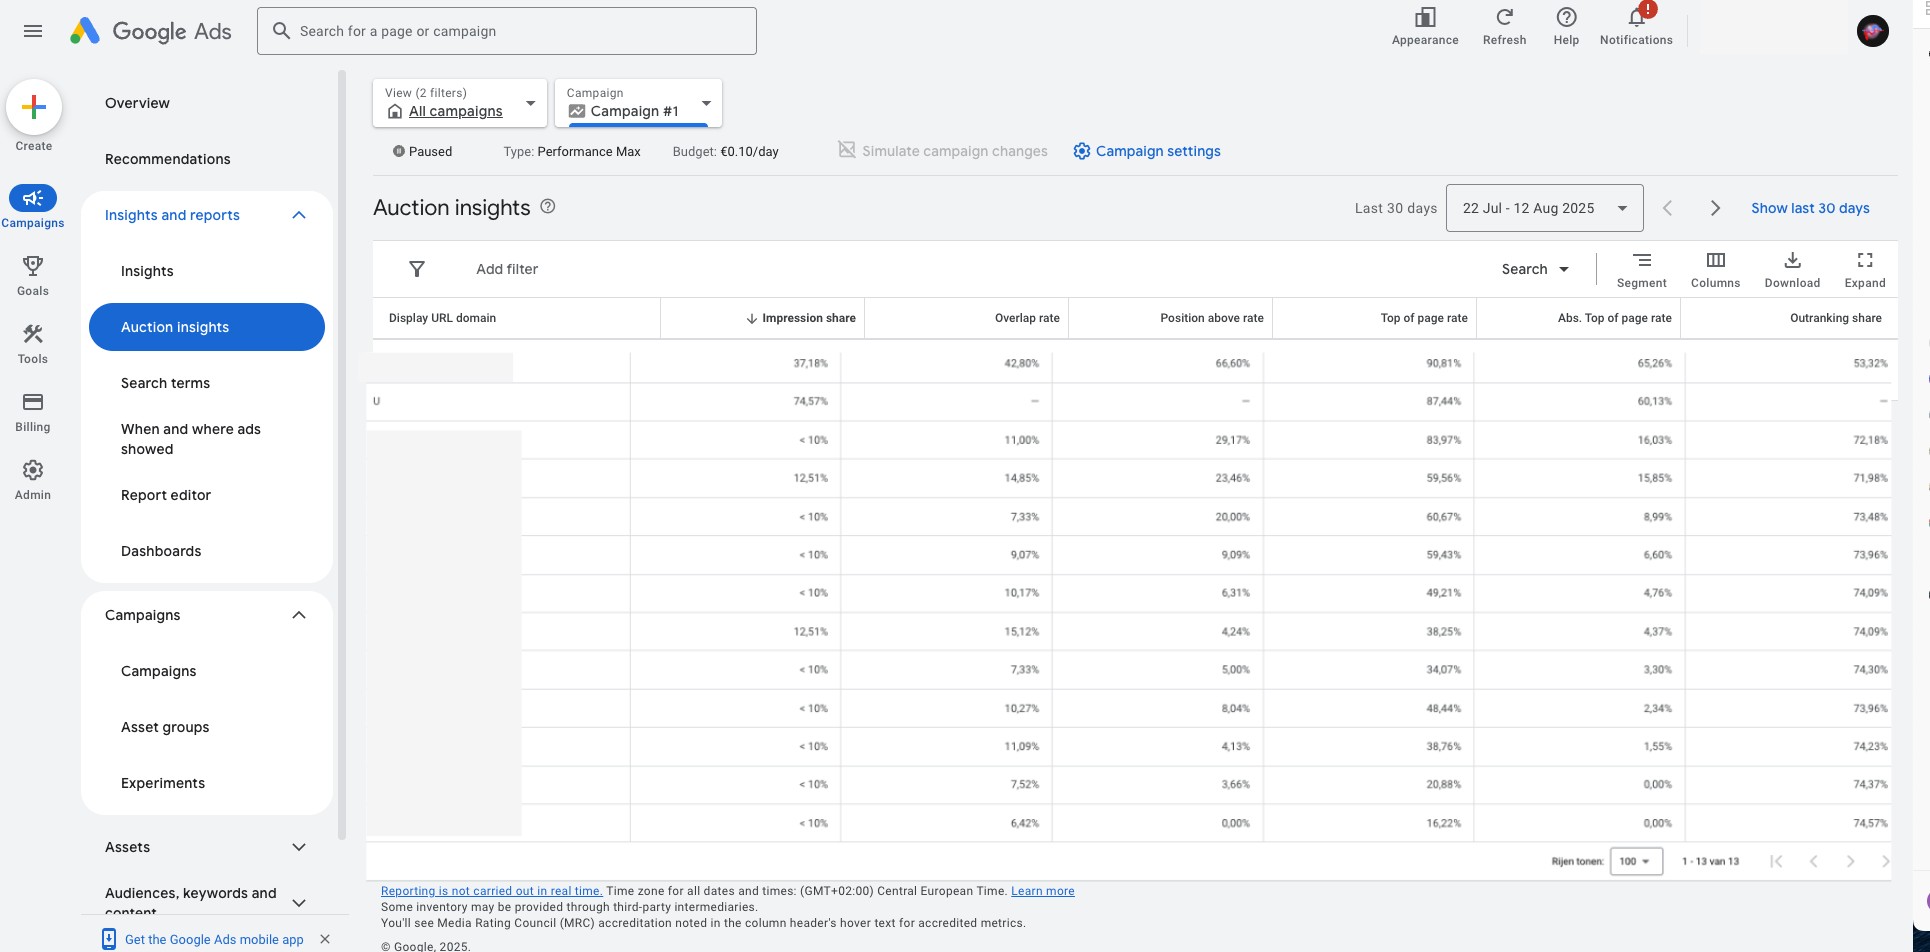
What Is the Google Ads Auction Insights Report?
The Google Ads Auction Insights report compares your campaign, ad group, or keyword performance to other advertisers competing in the same auctions. This means you can see:
- Which competitors are appearing alongside your ads.
- How frequently they show up compared to you.
- How often they rank above your ads.
- Where you have room to increase visibility and outrank rivals.
Accessible at campaign, ad group, or keyword level, it’s flexible enough for both high-level overviews and deep, keyword-level analysis.
Why Is Auction Insights So Important?
- Competitor visibility: Identify exactly which domains are appearing in your auctions and how aggressive they are.
- Performance benchmarking: Measure whether you’re outranking competitors or losing impressions to them.
- Targeting validation: Confirm you’re showing in the right auctions — and adjust if you see irrelevant players.
- Opportunity spotting: Discover new competitors entering your market before they become a threat.
- Strategic decision-making: Use hard data to justify bid changes, refine ad quality, or reallocate budget.
Key Metrics in the Google Ads Auction Insights Report (Explained in Depth)
Understanding these metrics is critical to making the most of Auction Insights. Here’s what each means, plus examples of how to use them strategically.
Visible URL Domain
The domain name of a competing advertiser that appears in the same auctions as you. This is your first clue as to who’s bidding on similar keywords. If you see unexpected domains, it might signal overly broad targeting or an untapped competitor niche.
Impression Share
The percentage of impressions your ad received out of the total impressions you were eligible to receive.
- Formula: Impressions received ÷ Total eligible impressions.
- Example: If you have a 40% impression share, you’re appearing in less than half of the auctions you could be in — possibly due to budget limits, low bids, or high competition.
- Optimization tip: Increase budget or improve Quality Score to boost impression share without overspending.
Overlap Rate
The percentage of auctions where your ad and a competitor’s ad were shown together.
- Why it matters: High overlap means you are directly competing for the same audience.
- Example: If Competitor A has an overlap rate of 80%, they’re targeting almost the exact same queries you are.
- Strategy: Decide if you want to compete head-on or differentiate your targeting.
Position Above Rate
The percentage of auctions where a competitor’s ad appeared in a higher position than yours when both were shown.
- Example: If Competitor B outranks you in 70% of shared auctions, they may have higher bids, better ad quality, or both.
- Action: Improve ad relevance, test new creatives, or adjust bidding strategy to win more top positions.
Top of Page Rate
The percentage of impressions where your ad appeared above the organic search results — not necessarily in the first position.
- Why it matters: Ads above the organic results get significantly higher CTRs.
- Tip: If your Top of Page Rate is low, test bid increases or better ad copy to improve placement.
Absolute Top of Page Rate
The percentage of impressions where your ad appeared as the very first result at the top of the page.
- Why it matters: This is the most visible ad position with the highest potential CTR.
- Example: If you have a 15% Absolute Top of Page Rate while a competitor has 60%, they are dominating brand visibility.
Outranking Share
The percentage of auctions where your ad ranked higher than a competitor’s ad, or where your ad appeared and theirs did not.
- Why it matters: This is a direct measure of competitive strength in the auction.
- Action: Track changes in this metric after bid adjustments or creative updates to measure impact.
Using Auction Insights to Check Targeting Accuracy
Auction Insights is a powerful targeting audit tool. If you see competitors that are completely irrelevant to your market, your targeting may be too broad. Conversely, if key competitors are absent, you may be missing important auctions — and potential revenue.
Strategic Example
Imagine running a campaign for prenatal care services. In Auction Insights, you notice competitors like houseofbirth.nl or evaverloskundigen.nl appearing in 60–90% of your auctions and outranking you most of the time. You could:
- Increase bids or budget to capture more impression share.
- Improve ad quality through more relevant headlines and extensions.
- Analyze competitor landing pages for inspiration or positioning shifts.
- Defend your brand with targeted campaigns if competitors bid on your name.
Bonus Tip: SKAGs + Exact Match for Laser Precision
By using Single Keyword Ad Groups (SKAGs) with exact match targeting, you get precise competitor data at the ad group level. This allows you to:
- See exactly which competitors bid on a specific keyword.
- Measure how often they outrank you for that term.
- Refine bids, ad copy, and landing pages for maximum effect.
Advanced Tips & Tricks to Get the Most Out of Google Ads Auction Insights
- Segment by device, location, or time: Discover where competitors are strongest and adjust your bids accordingly.
- Track seasonal competition shifts: Compare reports over months or quarters to anticipate changes.
- Combine with Search Terms report: Identify high-value queries where you’re losing ground.
- Benchmark your bidding strategy: Test automated vs. manual bidding to see which performs better in outranking share.
- Monitor for new market entrants: Early detection can give you a strategic edge.
- Measure the impact of changes: Run before/after comparisons when adjusting bids or creatives.
- Focus budget where competition is highest: Defend profitable areas while exploiting low-competition niches.
Conclusion
The Google Ads Auction Insights report is more than a competitive snapshot — it’s a strategic intelligence tool. By mastering its metrics, validating your targeting, and applying its insights to your bidding and creative strategy, you can gain a significant edge in the ad auction.
Used regularly — especially with SKAGs, exact match, and smart segmentation — Auction Insights will help you not just compete, but lead in your market.
Want to Learn More?
Explore other Google Ads insights and reporting tools in our Keyword Match Types Guide or learn the difference between SEO and SEA.