The BCG Matrix, also known as the Boston Consulting Group Matrix or Growth-Share Matrix, is a classic strategic planning tool that helps businesses evaluate their product portfolio and make informed decisions about resource allocation. Developed in the 1970s by BCG, it remains relevant today for marketers, business strategists, and product managers.
What is the BCG Matrix?
The BCG Matrix plots business units or products on a two-dimensional chart based on:
- Market growth rate (vertical axis): Indicates industry attractiveness
- Relative market share (horizontal axis): Measures competitive advantage
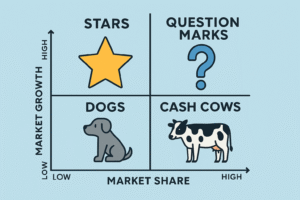
The matrix is divided into four quadrants:
- Stars: High growth, high market share
- Cash Cows: Low growth, high market share
- Question Marks: High growth, low market share
- Dogs: Low growth, low market share
The Four Quadrants Explained
1. Stars
- Characteristics: Leaders in high-growth markets
- Strategy: Invest heavily to maintain position
- Goal: Eventually become Cash Cows as market growth slows
2. Cash Cows
- Characteristics: Dominant in a mature, slow-growth market
- Strategy: Maximize profits and use the cash to fund Stars and Question Marks
- Goal: Maintain efficiency and defend market share
3. Question Marks
- Characteristics: Operate in high-growth markets but with low market share
- Strategy: Decide whether to invest and turn them into Stars, or divest
- Goal: Evaluate potential with care; high risk, high reward
4. Dogs
- Characteristics: Low market share in low-growth markets
- Strategy: Consider divestment or repositioning
- Goal: Avoid resource waste unless there’s strategic value
Why Use the BCG Matrix?
- Simplifies decision-making about investment priorities
- Identifies products to grow, sustain, or phase out
- Supports portfolio diversification
- Helps manage risk and resource allocation
The matrix provides a visual overview that’s easy to interpret, making it a popular starting point in strategic discussions.
Practical Example: A Consumer Electronics Brand
Imagine a company with the following product portfolio:
- Wireless Earbuds (Star): Growing demand and high market share
- Smartphones (Cash Cow): Dominant market player in a saturated segment
- Smartwatches (Question Mark): Popular category, but weak competitive position
- DVD Players (Dog): Declining industry with minimal market presence
Using the BCG Matrix, the company might:
- Increase marketing spend for earbuds
- Maintain profitability of smartphones
- Analyze potential or partnerships for smartwatches
- Phase out DVD players
Limitations of the BCG Matrix
- Oversimplifies complex markets
- Ignores external factors like brand strength or consumer behavior
- Assumes high market share always leads to profitability
- Doesn’t account for synergies between products
Therefore, the BCG Matrix should be used alongside other tools (like SWOT, Ansoff Matrix, or market research) for a well-rounded strategy.
Conclusion
The BCG Matrix is a powerful yet simple framework for evaluating product performance and shaping strategic priorities. While not without its limitations, it offers clear insights into where to invest, divest, or innovate. By regularly updating the matrix, businesses can stay agile in dynamic markets and ensure optimal portfolio management.