When to Use It
- You’re stress-testing a business idea and want a shared, testable model.
- You need to compare options (new segment, product line, pricing) side by side.
- Teams disagree on priorities; you want one page everyone interprets the same way.
- You’re planning experiments and want evidence notes next to assumptions.
- You’re preparing to pitch investors or stakeholders and need a clear, visual overview of your business model.
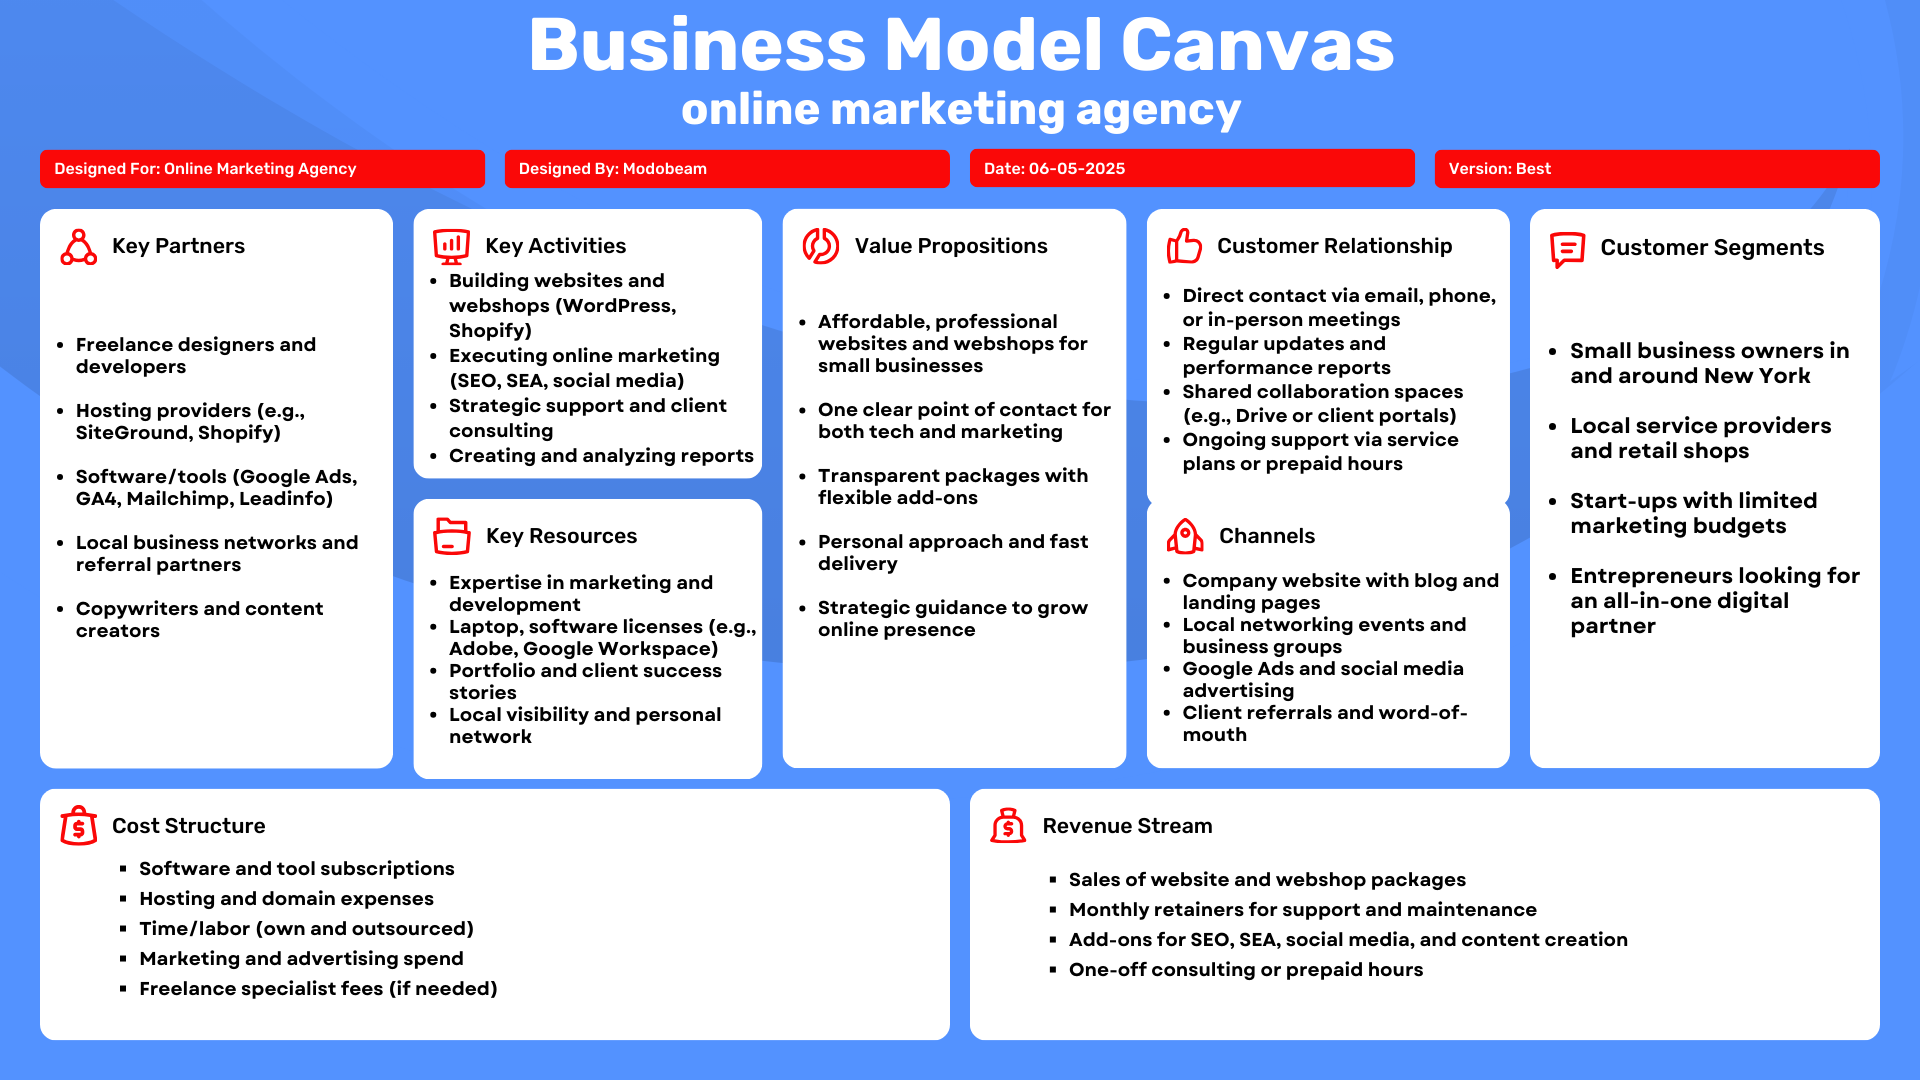
The Nine Building Blocks (Overview)
The Business Model Canvas is built on nine core building blocks. Each block represents a fundamental part of how a business creates, delivers, and captures value:
- Customer Segments — define who you serve and which groups of customers matter most.Example: IKEA targets budget-conscious households, students, and small businesses.
- Value Propositions — clarify why customers choose you over alternatives and what unique outcomes you deliver.Example: Tesla offers high-performance electric cars that combine sustainability with innovation.
- Channels — describe how you reach, educate, sell to, and deliver value to your customers.Example: Apple sells directly via its stores and website, but also through resellers.
- Customer Relationships — explain how you attract, onboard, and retain customers over time.Example: Netflix builds loyalty through personalized recommendations and seamless subscriptions.
- Revenue Streams — outline how your business earns money, from pricing logic to payment models.Example: Spotify combines premium subscriptions with ad-supported free accounts.
- Key Resources — identify the assets you rely on, such as people, technology, brand, data, or intellectual property.Example: Google’s key resources include its algorithms, massive data centers, and brand reputation.
- Key Activities — highlight the essential tasks your business must excel at to fulfill its value proposition.Example: Amazon focuses on logistics, warehousing, and fast delivery.
- Key Partnerships — show the external organizations, suppliers, or alliances that enable your business to succeed.Example: Starbucks partners with farmers and distributors worldwide for coffee supply.
- Cost Structure — define the costs of operating your model, balancing fixed vs. variable expenses and efficiency vs. value creation.Example: Airlines face high fixed costs (aircraft, staff) and variable costs (fuel).
Together, these nine building blocks provide a complete picture of your business model, helping you identify strengths, weaknesses, and opportunities for growth.
How to Fill the BMC (Fast and Rigorous)
- Set the decision up front: What changes once this canvas is finished?
- Draft in 20 minutes: one crisp, verifiable line per block (no essays).
- Coherence pass: read left→right as one story from customer to costs.
- Flag the top 3 assumptions: usually segment, value, or channel.
- Design quick tests: interviews, landing page, pricing probe, partner pilot.
The Building Blocks in Depth (Practical)
This section explains each Business Model Canvas (BMC) building block in plain language.
For every block you’ll find what it is, why it matters, a short checklist, useful metrics, and an example where helpful.
1) Customer Segments
What it is: The specific groups of people or organizations you serve. Clear boundaries beat “everyone.”
Why it matters: Focus improves product–market fit, messaging, and unit economics.
How to approach it
- Start from real problems and contexts (Jobs-to-Be-Done): situation, motivation, desired outcome, friction.
- In B2B, map decision roles: user, buyer, approver; plan for blockers like procurement or security.
Checklist
- Market sizing:
TAM /
SAM /
SOM. - Willingness to pay and switching triggers.
- Success criteria in the customer’s own words.
Metrics
Example: “Mid-market EU retailers on legacy platforms planning a Magento replatform who need a Hyvä storefront live within 12 weeks to meet holiday demand.”
2) Value Propositions
What it is: The outcomes that make customers choose you over alternatives.
Why it matters: Customers buy progress (outcomes), not features.
How to approach it
- Translate features → outcomes (pains removed, gains created).
- Add proof (benchmarks, case studies, guarantees).
- Name one defensible edge: speed, cost, ecosystem, data, brand, or IP.
Checklist
- Top 3 pains removed; top 3 gains created.
- Clear comparison vs. alternatives.
- Evidence for claims; a one-line promise.
Metrics
- Activation rate, time-to-value, cohort retention.
- Win–loss reasons; competitive win rate.
3) Channels
What it is: How you reach, educate, convert, deliver, and re-engage customers.
Why it matters: The right channel lowers acquisition cost and raises conversion.
How to approach it
- Map channels across the funnel: awareness → consideration → conversion → retention.
- Start narrow; master one primary channel before scaling.
- Match intent: bottom-funnel SEO/PPC; enablement content + email for onboarding and retention.
Checklist
- Channel–segment fit; ramp-up time.
- Operating readiness (people, tools, budget).
- Avoid cannibalization; fix attribution blind spots.
Metrics
- CAC by channel, CTR/CPA, ROAS.
- Payback period; activation from channel; assisted conversions.
4) Customer Relationships
What it is: How you acquire, onboard, support, and retain customers.
Why it matters: Relationship style should match ACV and product complexity.
How to approach it
- Choose a mode: self-service, assisted, community-led, high-touch, or automated.
- Design onboarding for the first moment of value; treat CX as part of the product.
Checklist
- Onboarding steps with success criteria.
- Communication cadence and support SLAs.
- Self-service help center; feedback loops.
Metrics
5) Revenue Streams
What it is: How money flows in—your pricing logic and models.
Why it matters: Pricing should reflect perceived value and be easy to understand.
How to approach it
- Choose model(s): one-time, subscription, usage-based, license, or hybrid.
- Package for outcomes; keep offers simple; test with bounded experiments.
Tactics
- Good/Better/Best tiers with value fences.
- Annual prepay with clear benefits.
- Usage add-ons, transparent calculators, bundles, founder/loyalty offers.
Metrics
- ARPU/ARPA, MRR/ARR, expansion revenue.
- Free→paid conversion; NRR.
6) Key Resources
What it is: The assets you cannot deliver without (people, tech, data, brand, IP).
Why it matters: These form core capability and often your moat.
Checklist
- “Pull-the-plug” test: if removed, does the value proposition fail?
- Replaceability and cost to maintain.
- Legal rights (IP), data quality, security posture.
Metrics
- Capacity utilization; uptime; defect rate.
- Critical-role retention; IP coverage; data freshness.
7) Key Activities
What it is: The few activities that most drive your north-star metric.
Why it matters: Focus here; everything else is support work or a candidate for outsourcing.
Checklist
- Top 3 activities tied to outcomes (e.g., performance engineering, CRO sprints, partner enablement).
- SOP maturity; automation opportunities.
- Compliance with SLAs and quality thresholds.
Metrics
- Cycle time and throughput.
- Release frequency / change lead time.
- Experiment velocity and success rate.
8) Key Partnerships
What it is: External organizations that give you cost, capability, speed, or market access.
Why it matters: The right partners unlock markets and reduce risk.
Checklist
- Selection criteria (fit, incentives, governance).
- Scope, exclusivity, data-sharing rules.
- Joint value proposition, shared metrics, exit plan.
Metrics
- Sourced/influenced pipeline; revenue share.
- SLA adherence; partner NPS.
- CAC payback on partner-sourced deals.
9) Cost Structure
What it is: The costs required to deliver value (fixed/variable; direct/indirect).
Why it matters: Your cost shape should match strategy (cost-driven vs. value-driven).
Checklist
- Top cost drivers and unit economics.
- Marginal cost; volume sensitivity; scenario plans.
- Cost-to-serve by segment; make-vs-buy analysis.
Metrics
- Gross margin; contribution margin.
- CAC payback; LTV:CAC ratio.
- Burn multiple (for startups).
Mini-Glossary
- TAM / SAM / SOM
- Total Addressable Market; Serviceable Available Market; Serviceable Obtainable Market.
- ICP
- Ideal Customer Profile.
- JTBD
- Jobs-to-Be-Done; the progress a customer is trying to make.
- ACV
- Average Contract Value.
- CAC
- Customer Acquisition Cost.
- LTV
- Customer Lifetime Value.
- ARPU / ARPA
- Average Revenue Per User / Account.
- MRR / ARR
- Monthly / Annual Recurring Revenue.
- NRR
- Net Revenue Retention.
- CTR / CPA / ROAS
- Click-Through Rate; Cost Per Acquisition; Return On Ad Spend.
- NPS / CSAT
- Net Promoter Score; Customer Satisfaction score.
- TTFV
- Time To First Value.
- Contribution margin
- Revenue minus variable costs (per-unit profitability after variable costs).
- Payback period
- Time to recover CAC from gross profit.
- Burn multiple
- Cash burned divided by net new ARR.
- Unit economics
- Profitability per unit/customer.
- North-star metric
- The single metric that best captures delivered value.
- SLA
- Service Level Agreement (e.g., response times, uptime).
- IP
- Intellectual Property: patents, trademarks, copyrights, trade secrets, and licensing rights.
Read the Canvas as One Story
For Customer Segments we deliver Value Propositions via Channels, maintain Customer Relationships, monetize through Revenue Streams, enabled by Key Resources, Key Activities, and Key Partnerships, all sustainable within our Cost Structure. If any element contradicts another, refine before scaling.
BMC vs. Lean Canvas vs. Value Proposition Canvas
Business Model Canvas (bmc business model canvas): end-to-end operating model; ideal for alignment and scaling. Lean Canvas: swaps blocks for Problem/Solution/Key Metrics/Unfair Advantage; best for early validation. Value Proposition Canvas: deep dive on the fit between customer jobs/pains/gains and your product/service value map.
Use Lean Canvas when validating a fresh business idea. Use the BMC to align an operating model. Use the Value Proposition Canvas to sharpen the promise before scaling channels.
Metrics and Simple Formulas
- Segments: ICP fit %, lead quality, segment NPS.
- Value: activation rate, time-to-value, retention cohorts.
- Channels: CAC by channel, CTR/CPA, ROAS, payback period.
- Relationships: onboarding completion, support CSAT, referral rate.
- Revenue: ARPU/ARPA, MRR/ARR, expansion revenue, NRR.
- Costs: gross margin, contribution margin, burn multiple.
Formulas: CAC = Sales & Marketing Spend ÷ New Customers. LTV (subscription) ≈ ARPU × Gross Margin % × Customer Lifetime (months). Payback = CAC ÷ (ARPU × Gross Margin %). Contribution Margin = Revenue − Variable Costs.
From Canvas to Action (14-Day Plan)
- Days 1–2: Draft v1 and list the three riskiest assumptions.
- Days 3–5: 8–10 interviews; capture jobs, pains, alternatives, willingness to pay.
- Days 6–7: Landing page or MVP; define one activation metric.
- Days 8–10: Launch a single channel test (ads, outbound, or partner).
- Days 11–12: Analyze; update BMC v1.1 with evidence notes.
- Days 13–14: Choose the next experiment; set a weekly review cadence.
Worked Examples — Full Business Model Canvas Tables
IKEA
| Block | IKEA — Business Model Canvas |
|---|---|
| Customer Segments | Cost-conscious households, students, and first-home buyers seeking stylish, durable furniture at accessible prices; B2B for small offices and hospitality fit-outs. |
| Value Propositions | Well-designed, flat-pack furniture at low prices; immediate take-home availability; immersive in-store experience with room sets; sustainable lines and materials; distinctive Swedish brand aesthetic. |
| Channels | Large destination stores; website and app with click-and-collect and delivery; local pickup points; catalogs/newsletters; social; select marketplace pilots. |
| Customer Relationships | Primarily self-service with guided in-store flows; planning tools for kitchens and storage; support for delivery/assembly add-ons; loyalty program (IKEA Family). |
| Revenue Streams | Product sales (furniture, decor), food & beverage in stores, services (assembly, delivery), B2B orders. |
| Key Resources | Global brand, product design library, supplier network, private-label manufacturing, logistics/warehousing footprint, data on store traffic and flows. |
| Key Activities | Design & sourcing, demand planning, flat-pack optimization, store operations, supply chain management, sustainability programs, merchandising. |
| Key Partnerships | Long-term suppliers, logistics carriers, renewable energy partners, assembly service providers, real-estate partners for store locations. |
| Cost Structure | Manufacturing/procurement, logistics and warehousing, large store leases and staffing, marketing, sustainability investments. |
| Notes & Metrics | Low price perception and availability drive volume; watch stockouts and last-mile costs. Track basket size, store heatmaps, delivery attach-rate, repeat visits, NPS. |
Netflix
| Block | Netflix — Business Model Canvas |
|---|---|
| Customer Segments | Global households and individuals seeking on-demand entertainment; price-sensitive segments in ad-supported tiers; families needing kids profiles and controls. |
| Value Propositions | Large multi-genre content library; device ubiquity; personalized recommendations; smooth streaming; flexible plans including ad tiers. |
| Channels | Apps on smart TVs, mobiles, consoles; website; device OEM preload partnerships; trailers, social, PR. |
| Customer Relationships | Self-service subscription with personalization; help center/chat; parental controls; reactive churn-save prompts. |
| Revenue Streams | Subscriptions (ad-free and ad-supported); regional licensing; emerging revenue from advertising and merchandising in select markets. |
| Key Resources | Content catalog and originals, recommendation engine and data science, brand, engineering teams, CDN contracts, device partnerships. |
| Key Activities | Content acquisition/production, platform engineering, personalization R&D, marketing and lifecycle comms, ad sales for ad-tier. |
| Key Partnerships | Studios, production houses, device OEMs, CDNs, advertisers/agencies for ad tiers. |
| Cost Structure | Content spend (production/licensing), platform/infra (CDN, cloud), marketing, customer support, ad tech ops. |
| Notes & Metrics | Churn and content hits drive outcomes. Track hours viewed, completion rates, sign-ups by device, ARPU by plan, churn, ad fill rate and CPMs for ad tier. |
Spotify
| Block | Spotify — Business Model Canvas |
|---|---|
| Customer Segments | Music and podcast listeners worldwide; creators/podcasters; advertisers on the free tier; family/student plans for price-sensitive users. |
| Value Propositions | On-demand music/podcasts; personalized discovery (Discover Weekly); cross-device continuity; offline listening in Premium; tools and analytics for creators. |
| Channels | Mobile/desktop apps; smart speakers/car integrations; telco bundles; social sharing; editorial and algorithmic playlists. |
| Customer Relationships | Freemium self-service funnel; playlists and personalization as the relationship engine; creator portals and support. |
| Revenue Streams | Premium subscriptions (individual/family/student); ads on free tier; creator-facing marketplace tools in select areas; bundles via telcos and partners. |
| Key Resources | Licensing agreements, recommendation algorithms, brand, user data, creator relationships, distribution deals, ad tech stack. |
| Key Activities | Licensing and royalty management, algorithm R&D, product iteration, playlist curation, ad sales and trafficking, creator relations. |
| Key Partnerships | Record labels/distributors, podcast networks, device makers, telcos for bundles, car OS partnerships. |
| Cost Structure | Royalties/licensing, product/engineering, marketing, ad sales ops, partnerships and BD, payments/chargebacks. |
| Notes & Metrics | Economics hinge on royalty structure and conversion free→paid. Track MAU/DAU, time spent, conversion, churn, ARPU, ad impressions/fill rate, payout ratios. |
Coherence Checklist (Quality Scorecard)
Before you publish or present your canvas, pressure-test it with a short scorecard. The goal is not perfection; it is internal consistency—your story must hold together from left to right and be credible when translated into numbers.
- Segment – Value fit: Can a real customer say, “That solves my exact problem right now”?
- Value – Channel fit: Do your buyers actually use the channels you list to discover and evaluate solutions?
- Relationship – Price fit: Does the relationship style match ACV and complexity (e.g., high-touch for six-figure deals)?
- Revenue – Cost fit: Do preliminary unit economics (gross margin, payback) make sense at your price point?
- Activities – Resource fit: Do you truly have (or can you partner for) the capability to perform your key activities at the required quality?
- Risk notes: Are your top three uncertainties explicitly named with a test plan and owner?
EU B2B Reality: Procurement, Privacy, and Risk
Many business model canvas templates ignore procurement and compliance, but in EU B2B they can make or break a deal. Bake these into the canvas so your timeline and costs are realistic.
- Security & privacy: DPA, sub-processor lists, SOC2/ISO attestations, DPIA for sensitive processing, GDPR-compliant consent flows.
- Legal & finance: MSAs, country-specific invoicing/VAT, vendor portals, insurance requirements.
- IT integration: SSO/SAML, SCIM provisioning, data residency, API limits, sandbox access for pilots.
- Accessibility: WCAG adherence if you sell to public sector bodies.
- Procurement timeline: include review cycles and approvals in Customer Relationships and Key Activities.
Common Mistakes and How to Fix Them
- Vague segments: Replace “SMBs” with a quantified ICP (e.g., “EU retailers, €5–25M revenue, migrating in next 6 months”).
- Feature-speak: Rewrite in outcomes and add proof (before/after metrics, time saved).
- Too many channels: Pick one primary, one secondary until you hit repeatability.
- Free plan with no path to paid: Define a sharp fence (usage, seats, premium features) and communicate upgrade moments.
- Underpriced premium value: Run tier tests; measure win rate and payback, not just click-through.
- Ignoring variable costs at scale: Model shipping, support, or cloud costs at 10× volume and protect margin floors.
Pricing Math Vignette (Quick Sanity Check)
Suppose your experimentation SaaS is €49 ARPA on the Starter tier at 80% gross margin. Contribution per month is €39.20. If blended CAC is €275, payback is €275 ÷ €39.20 ≈ 7.0 months. If average lifetime is 24 months, LTV ≈ 49 × 0.8 × 24 = €940.8, giving an LTV:CAC of ~3.4:1 — healthy for early stage. If you introduce a €99 Growth tier chosen by 25% of new customers, ARPA rises; re-run the math and check whether CAC moves (often it does). The BMC is not a finance sheet, but a five-minute calculation prevents months of wishful thinking.
Operating Cadence and Evidence Log
Treat your canvas like code. Keep a published version and a working copy, name files consistently (e.g., core_bmc_v3_2025-08-19), and add a brief change log under each block with links to evidence: interview notes, dashboards, experiment write-ups. Run a monthly review for small corrections and a quarterly reset tied to planning, budgets, and hiring. When a hypothesis survives two consecutive quarters and metrics meet thresholds — payback within target, retention stable — promote it from an experiment to an operating rule. This lightweight governance makes the canvas a living strategy, not a poster on the wall.
Conclusion
The Business Model Canvas only helps if it drives decisions. Keep each block short, test the riskiest assumptions with real customers, and update the canvas as evidence arrives. The three tables show repeatable patterns: IKEA’s cost-driven scale and experiential retail, Netflix’s subscription flywheel powered by content and personalization, and Spotify’s freemium funnel where recommendations are the relationship. Map your own nine blocks with the same precision, pick one growth thesis, and prove it in the next two weeks. That’s how a canvas model becomes a working business strategy canvas — clear, testable, and built for momentum.