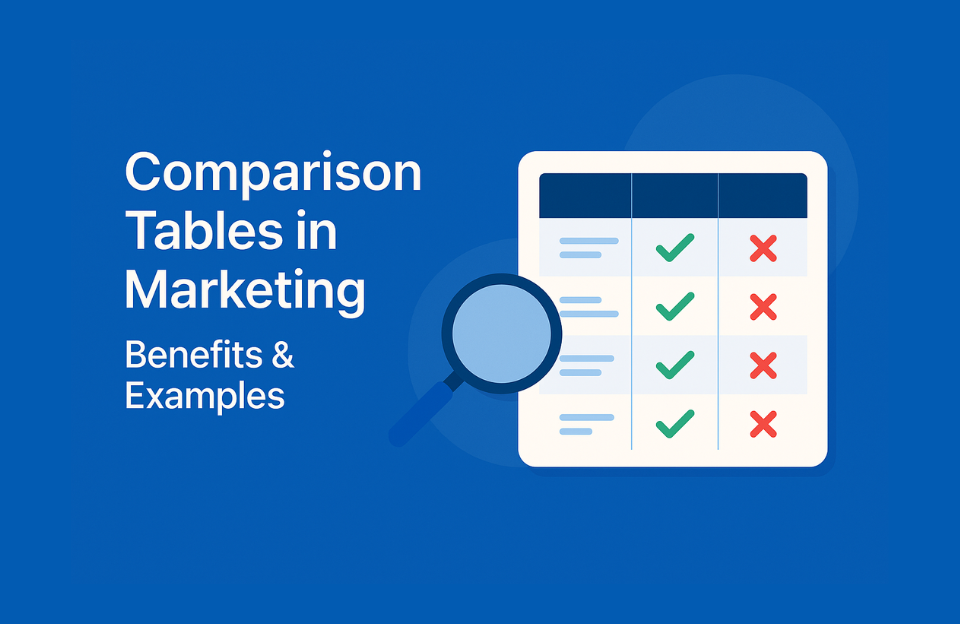
Comparison Tables: Structured Comparisons That Drive Decisions and Boost SEO
Comparison tables are a powerful content format that simplify complex decisions. By structuring features, prices, or benefits in a clear and scannable format, they not only help users make informed choices — they also boost your visibility in search results and enhance your website’s authority.
What Are Comparison Tables?
A comparison table is a visual layout that places two or more products, services, or solutions side by side. It highlights their features, specifications, pros and cons, or pricing in a structured grid. These tables are often used on versus pages, product pages, landing pages, and blog posts to help readers quickly understand the differences between options.
Why Comparison Tables Work
- Cognitive Ease: Visual layouts reduce mental load and improve scanability.
- Decision Support: Helps users evaluate and choose between options with confidence.
- Higher Engagement: Increases time on page and interaction rates.
- AI & SEO Friendly: Structured HTML is easily crawled and surfaced by search engines and AI tools.
When to Use Comparison Tables
- Product comparisons (e.g., iPhone vs. Galaxy)
- Feature breakdowns (e.g., Basic vs. Pro plan)
- Alternative tools (e.g., Mailchimp vs. ConvertKit)
- Pricing displays (e.g., monthly vs. annual plans)
Real-World Examples
- Tech Blogs: Sites like TechRadar use tables to compare smartphones, laptops, etc.
- Affiliate Sites: Wirecutter uses tables to drive clicks and conversions.
- SaaS Companies: Tools like Ahrefs show plan features side by side to boost sign-ups.
- E-commerce: Amazon adds “Compare with similar items” tables on product pages.
SEO Benefits of Comparison Tables
- Enhanced structured data and readability by crawlers
- Keyword variety and context for better indexing
- Eligibility for featured snippets and AI summaries
- Improved user signals like lower bounce rates and higher dwell time
Best Practices
- Use native HTML, not image-based tables
- Make them mobile-friendly and responsive
- Highlight key differences clearly
- Keep content focused and updated
Tools to Build Comparison Tables
- TablePress (WordPress)
- Notion + Embed
- Google Sheets → HTML export
- Manual HTML/CSS for full control
Common Mistakes to Avoid
- Using images instead of HTML tables
- Adding too many comparison points
- Outdated data or misleading specs
- Not optimizing for mobile
- Unclear formatting or no standout differences
Conclusion
Comparison tables are more than just visual aids — they’re strategic tools that boost decision-making, enhance SEO, and make your content more AI-accessible. If you want to improve clarity, increase rankings, and help users choose your solution, it’s time to start building structured tables that work.