
This article highlights nine advanced budget metrics that can be created with custom columns. Each section includes the metric’s purpose, formula, applicable level, and the correct data format—making it easy to implement directly in Google Ads or dashboards like Looker Studio or Supermetrics.
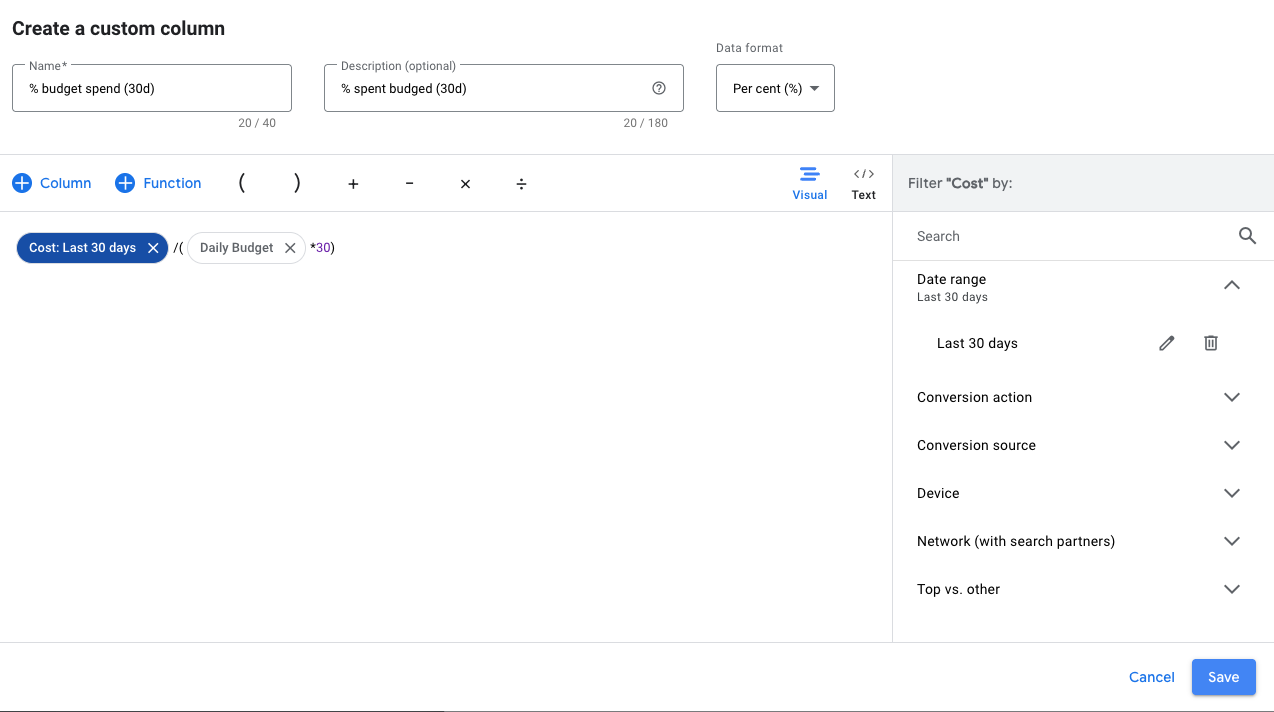
1. Daily Budget Spend (%)
What it shows: The average percentage of your daily budget spent within the selected date range.
(Cost.between_dates(report_range_start, report_range_end) / report_days_count()) / Daily_BudgetLevel: Campaign, Ad Group, Keyword
Data Format: Percentage (%)
Why it matters: Helps detect under- or overspending. Spending below 100% means you might miss impressions; above 100% may signal inefficiencies.
2. New Daily Budget Recommendation
What it shows: The adjusted daily spend required to reach your monthly budget goal by the end of the month.
(budget - Cost.between_dates(month_start, yesterday)) / (day(offset_days(offset_months(month_start(), 1), -1)) - (day(today()) - 1))Level: Campaign, Ad Group, Keyword
Data Format: Percentage (%)
Why it matters: Ensures accurate pacing, especially when spend has been lower than expected earlier in the month.
3. Budget Run Rate (%)
What it shows: Compares actual spend so far this month to the budget you should have spent by today to stay on track.
(Cost.between_dates(month_start, yesterday)) / ((budget / day(offset_days(offset_months(month_start(), 1), -1))) * (day(today()) - 1))Level: Campaign
Data Format: Percentage (%)
Why it matters: Below 100% = room to scale. Above 100% = risk of overpacing. Essential for controlling budget flow.
4. Budget Utilization Rate (Last 30 Days)
What it shows: Average daily spend over the past 30 days compared to your daily budget.
Cost.date_range(last_30_days) / 30 / Daily_BudgetLevel: Campaign
Data Format: Money
Why it matters: Offers a long-term view of budget consistency, useful for identifying slow-burning inefficiencies or seasonal trends.
5. Impression Lost (Budget)
What it shows: The estimated number of impressions lost due to budget constraints.
Impr / Search_impr_share * Search_Lost_IS_budgetLevel: Campaign, Ad Group, Keyword
Data Format: Number
Why it matters: Lost impressions = lost reach. A critical early warning sign for campaigns that are too limited in budget.
6. Click Lost (Budget)
What it shows: Estimated number of clicks lost because of insufficient budget.
(Impr / Search_impr_share * Search_Lost_IS_budget) * CTRLevel: Campaign, Ad Group, Keyword
Data Format: Number
Why it matters: Quantifies the real-world traffic missed due to budget limits.
7. Conversion Lost (Budget)
What it shows: Number of conversions you likely missed due to budget constraints.
((Impr / Search_impr_share * Search_Lost_IS_budget) * CTR) * (Conversions / Clicks)Level: Campaign, Ad Group, Keyword
Data Format: Number
Why it matters: Links budget limits directly to potential lost business value.
8. Revenue Lost (Budget)
What it shows: Estimated revenue loss caused by missed conversions due to budget capping.
(((Impr / Search_impr_share * Search_Lost_IS_budget) * CTR) * (Conversions / Clicks)) * (Conversion_value / Conversions)Level: Campaign, Ad Group, Keyword
Data Format: Money
Why it matters: Makes a strong case for increasing budget by showing direct revenue potential.
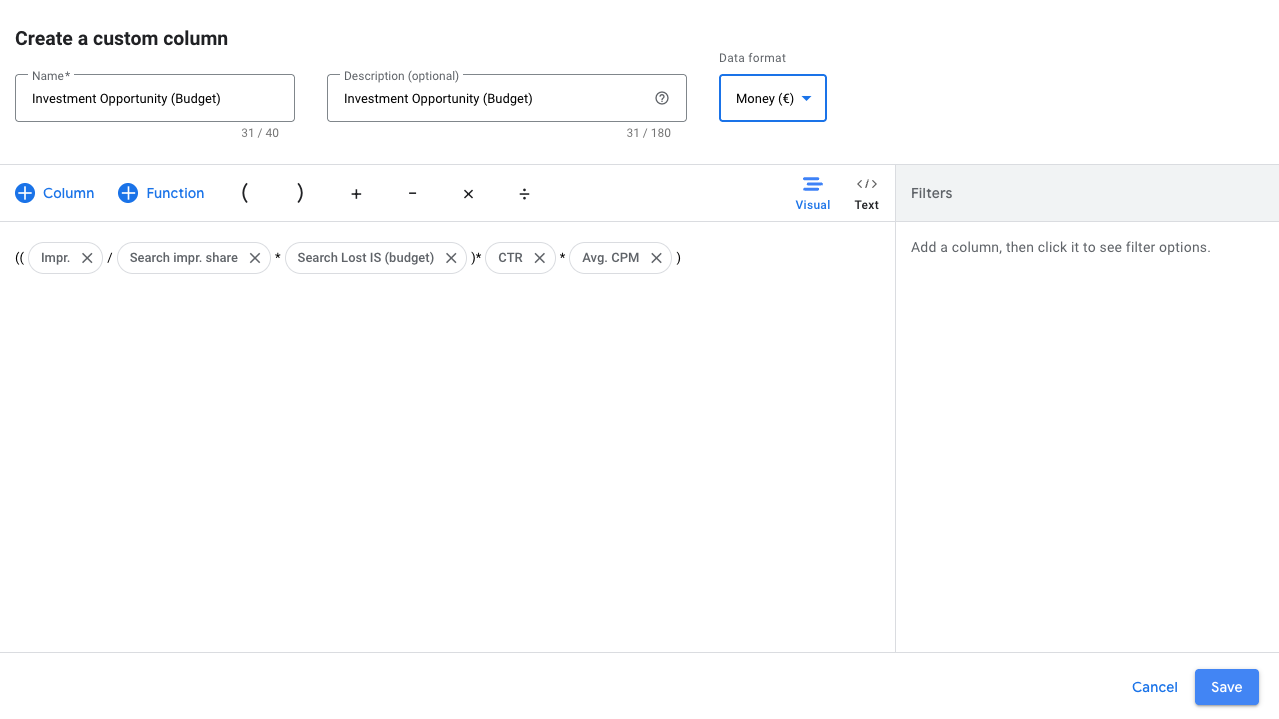
9. Investment Opportunity (Budget)
What it shows: How much additional budget is needed to meet untapped demand.
((Impr / Search_impr_share * Search_Lost_IS_budget) * CTR) * Avg_CPCLevel: Campaign, Ad Group, Keyword
Data Format: Money
Why it matters: Helps identify scalable campaigns where budget expansion could yield results.
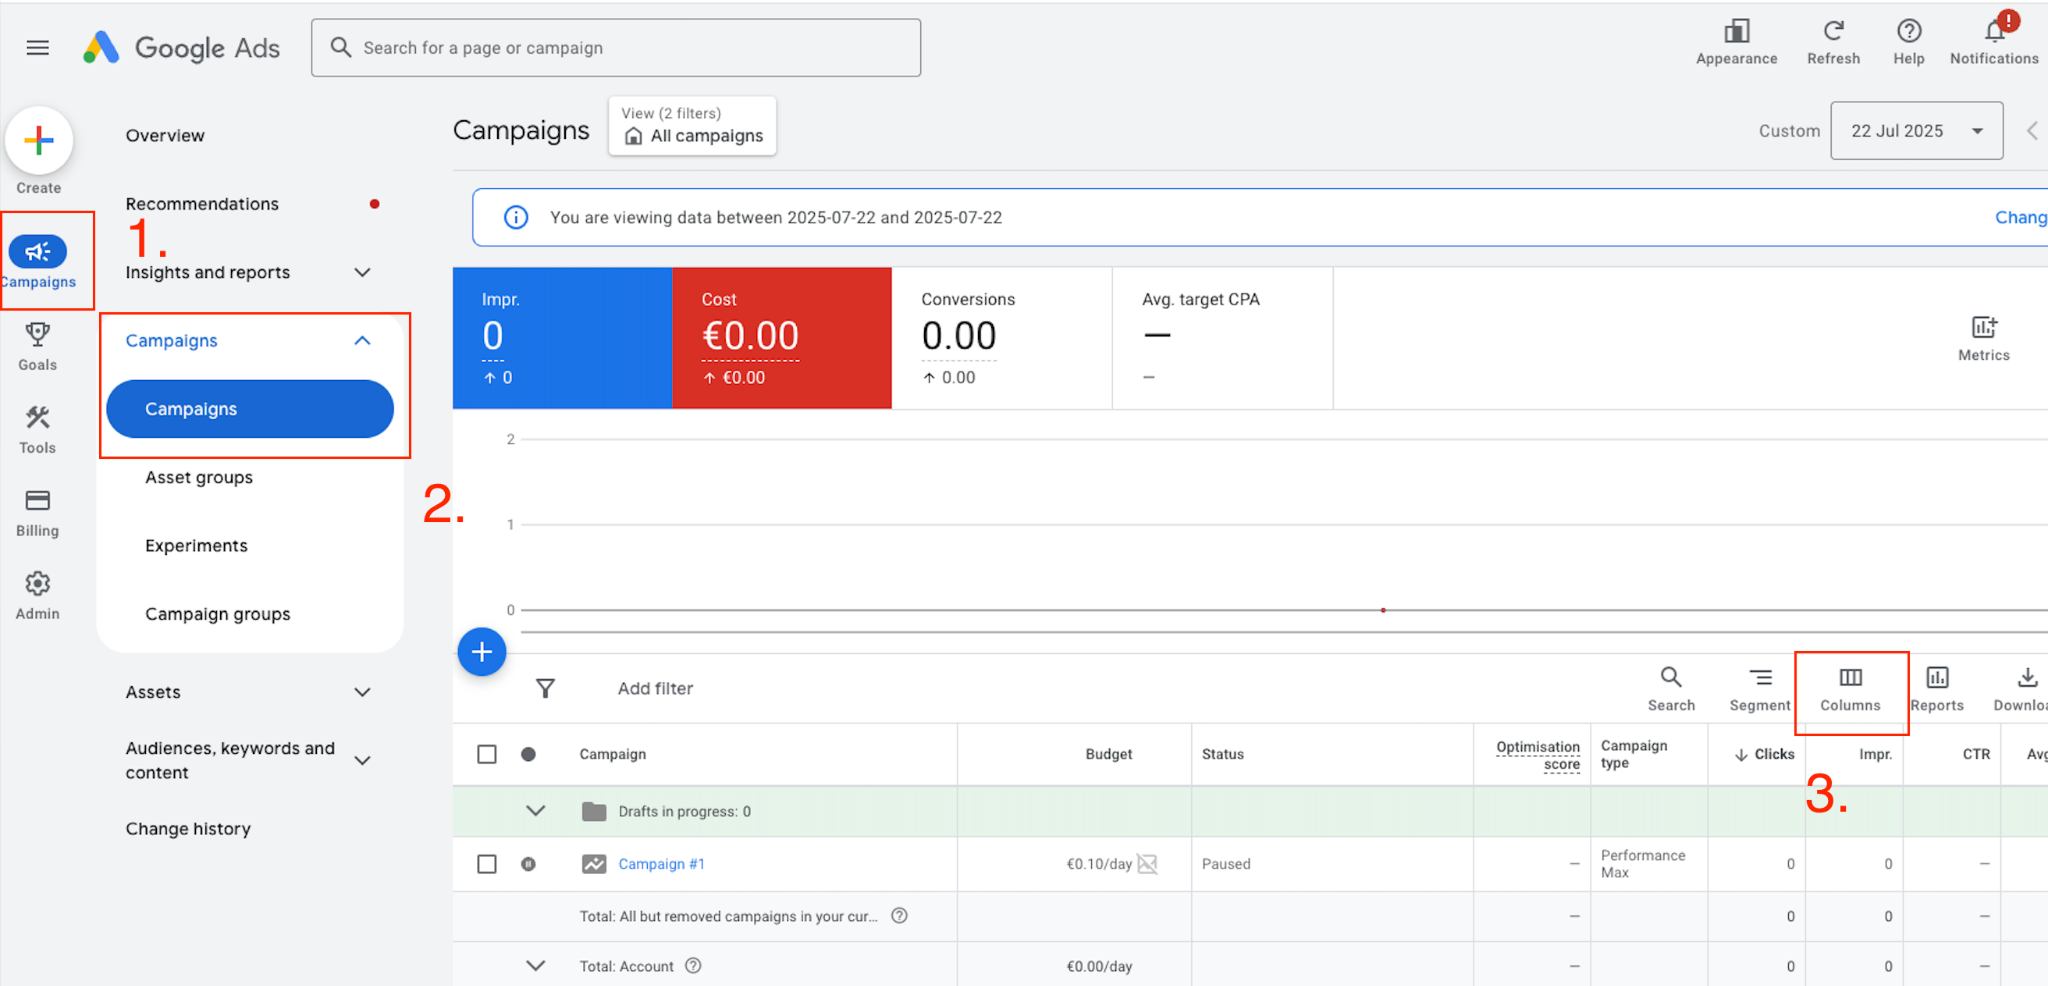
Where to Find and Adjust Custom Columns in Google Ads
You can create and manage custom columns directly within the Google Ads interface. Here’s how:
- Open your Google Ads dashboard.
- Go to any campaign, ad group, or keyword table.
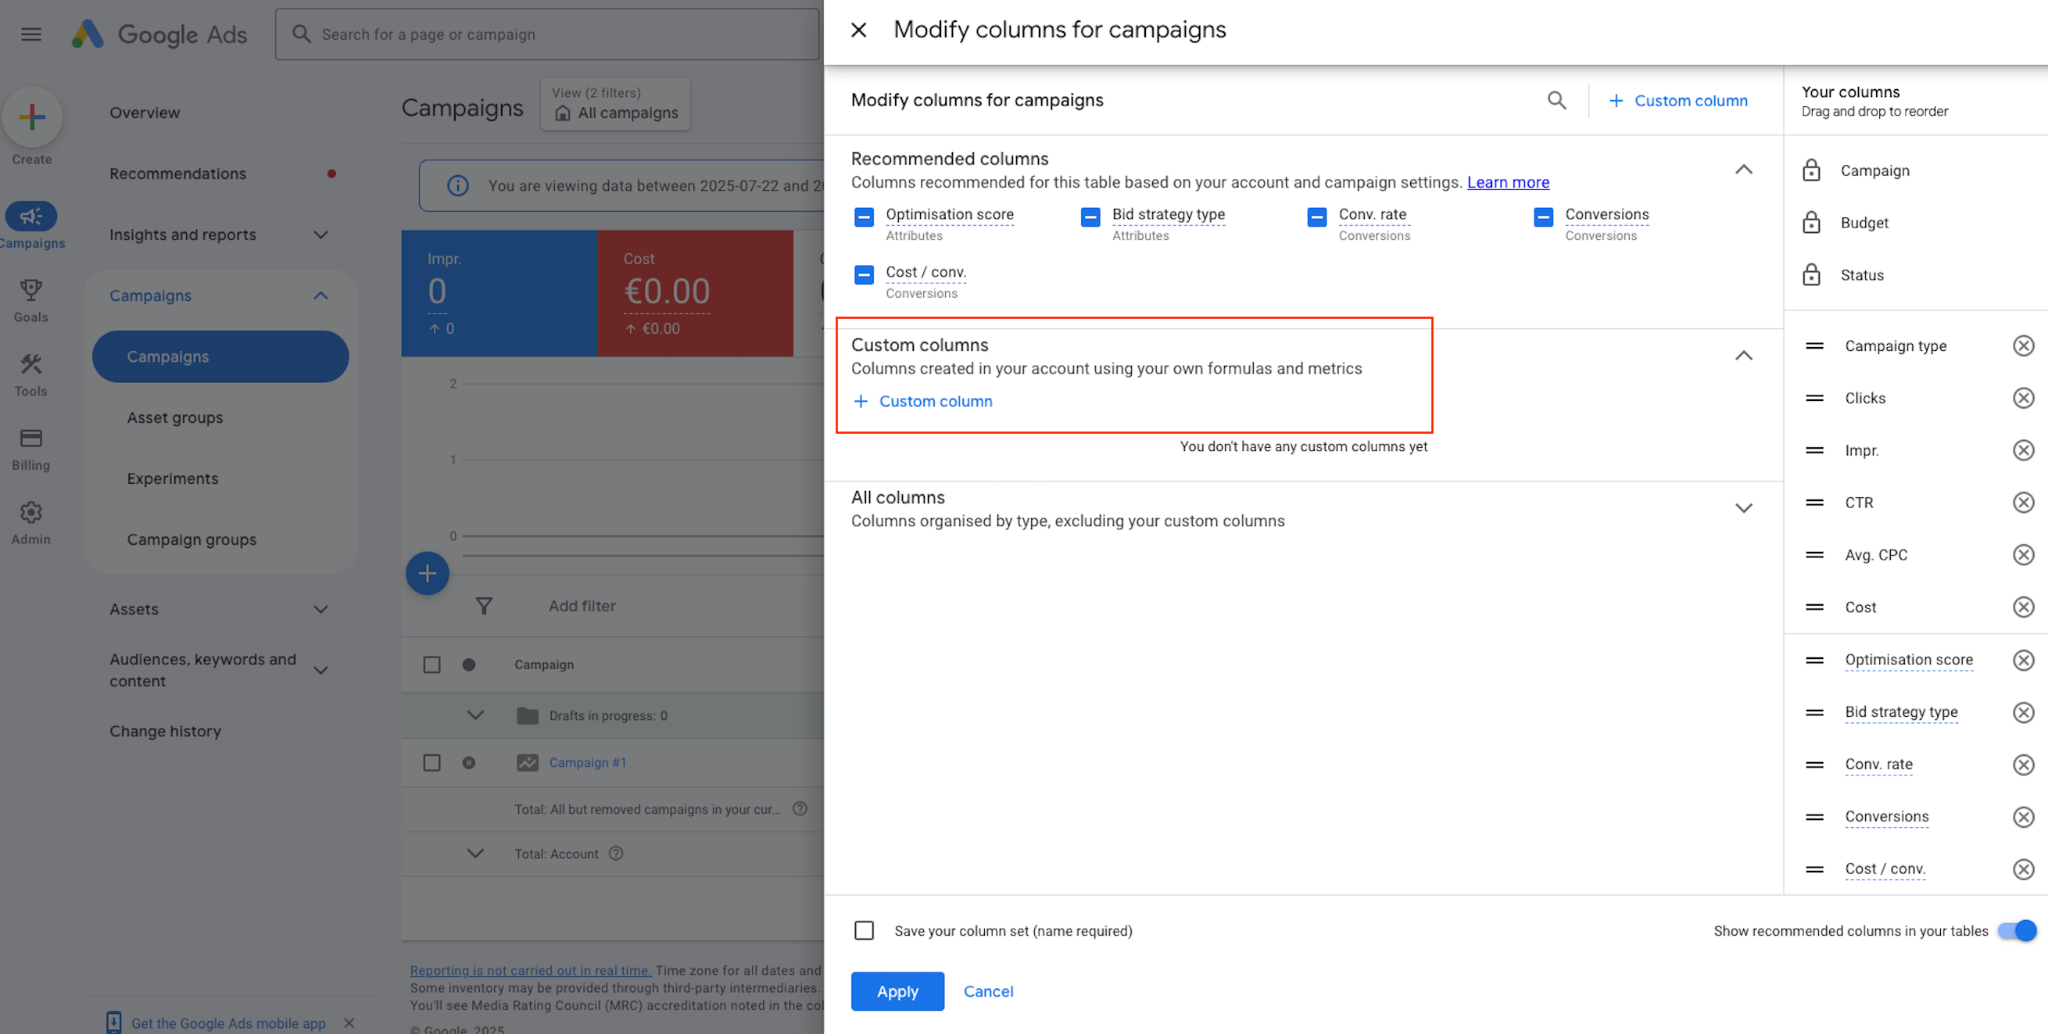
- Click on the ‘Columns’ icon above the table, then choose ‘Modify columns’.
- Select ‘Custom columns’ from the sidebar.
- Click ‘+ New column’ to define a new metric.
- Give it a name, enter your formula, and choose the correct data format (e.g., percentage, number, money).
Once created, your custom columns can be saved and reused across multiple views or exported to reporting tools.
1.
2.
3.
Conclusion: Turn Google Ads Data into Strategy
Custom columns in Google Ads are more than a reporting convenience—they unlock real strategic insights. By creating tailored formulas and choosing the correct formats and levels, you gain full control over how you monitor budget performance.
- Track pacing and performance with precision
- Uncover missed opportunities and potential revenue
- Support smart decision-making with data-driven metrics
- Save time with reusable, customizable reporting structures
Whether you’re running a single campaign or managing hundreds, custom columns turn raw metrics into real business value.