Google Analytics is a powerful tool that provides detailed insights into the performance of your website. But understanding how to use the various reports can help you make data-driven decisions that improve your site’s performance. In this guide, we’ll explore what Google Analytics reports are, why they matter, and, most importantly, what you can do with the data they provide.
What Are Google Analytics Reports?
Google Analytics reports offer in-depth information about your website’s visitors, how they interact with your content, and how well your website meets its business objectives. These reports go beyond basic traffic stats—they help you understand your audience’s behavior, identify trends, and uncover opportunities for optimization.
Why Are Google Analytics Reports Important?
- Measure Website Success: Knowing how well your website performs across different metrics allows you to determine whether your business objectives are being achieved.
- Make Data-Driven Decisions: With the insights from reports, you can improve decision-making processes by making adjustments based on actual data.
- Optimize Campaigns: By understanding traffic sources, user behavior, and conversions, you can optimize your marketing strategies and increase ROI.
- Improve User Experience: Reports on user engagement can show you what works and what doesn’t, helping you fine-tune the user experience and boost satisfaction.
What You Can Do with Google Analytics Reports
Let’s go deeper into how you can use these key reports to drive improvements and growth for your website.
1. Acquisition Reports: Understand Traffic Sources
What You Can Do: Acquisition reports tell you where your website visitors are coming from—whether it’s organic search, paid ads, social media, email campaigns, or direct visits. By analyzing this data, you can:
- Allocate Marketing Budget: If one source (e.g., organic search) is outperforming others, you might want to allocate more resources to that channel.
- Optimize Campaigns: Knowing which channels are bringing in traffic allows you to optimize existing campaigns or focus on new opportunities.
- Identify Effective Campaigns: Track the performance of your paid campaigns, social media, or email marketing efforts, and make adjustments as necessary.
Example: If you see that social media traffic is increasing, but organic search is declining, it might indicate that your SEO strategy needs attention, or you might want to double down on social media advertising.
2. Behavior Reports: Improve User Engagement
What You Can Do: Behavior reports show how visitors interact with your website. These include data on page views, bounce rates, and user navigation patterns. By diving deeper into this data, you can:
- Optimize High-Traffic Pages: If certain pages are getting high traffic but have a high bounce rate, it might indicate that users are not finding what they expect. You can optimize these pages for better engagement.
- Enhance Content Strategy: By analyzing which pages keep users engaged, you can refine your content strategy to focus on topics that resonate with your audience.
- Improve Site Navigation: If users frequently exit after visiting a certain page, it could indicate that your navigation needs improvement. You might consider adding clear calls-to-action (CTAs) or enhancing internal linking.
Example: If a blog post is getting a lot of page views but has a high bounce rate, you may need to add better internal links, CTA buttons, or related articles to encourage deeper exploration of your site.
3. Conversion Reports: Track Business Goals
What You Can Do: Conversion reports track user actions that align with your business goals, such as filling out a contact form, making a purchase, or subscribing to a newsletter. This data helps you:
- Measure Campaign Effectiveness: Track the success of your campaigns in driving conversions. If conversions are low, it’s time to analyze and tweak your strategies.
- Refine Funnel Optimization: If visitors are reaching certain pages but not completing desired actions (like purchases), you can work on improving your conversion funnels by simplifying forms or reducing friction points.
- Understand Customer Behavior: Conversion reports help you understand which elements of your website or marketing efforts are leading to successful user actions.
Example: If you notice a drop-off between the product page and checkout, it might suggest issues with the checkout process. You could consider offering discounts or simplifying the checkout process to boost conversions.
4. Audience Reports: Personalize Marketing Strategies
What You Can Do: Audience reports provide demographic data (age, gender, location) as well as insights into user interests and behaviors. You can use this information to:
- Tailor Content to Your Audience: With insights into your audience’s interests, you can create more targeted content that resonates with specific segments.
- Improve Targeting in Ads: If you see that a particular demographic is engaging more with your site, you can tailor your paid advertising efforts to better target those users.
- Segment Your Audience: Create specific segments in Google Analytics to track and compare user behavior across different groups, such as new vs. returning visitors or users from different countries.
Example: If you find that users in a certain age group are more likely to complete a purchase, you can create personalized ads for that demographic and focus your efforts on content that appeals to them.
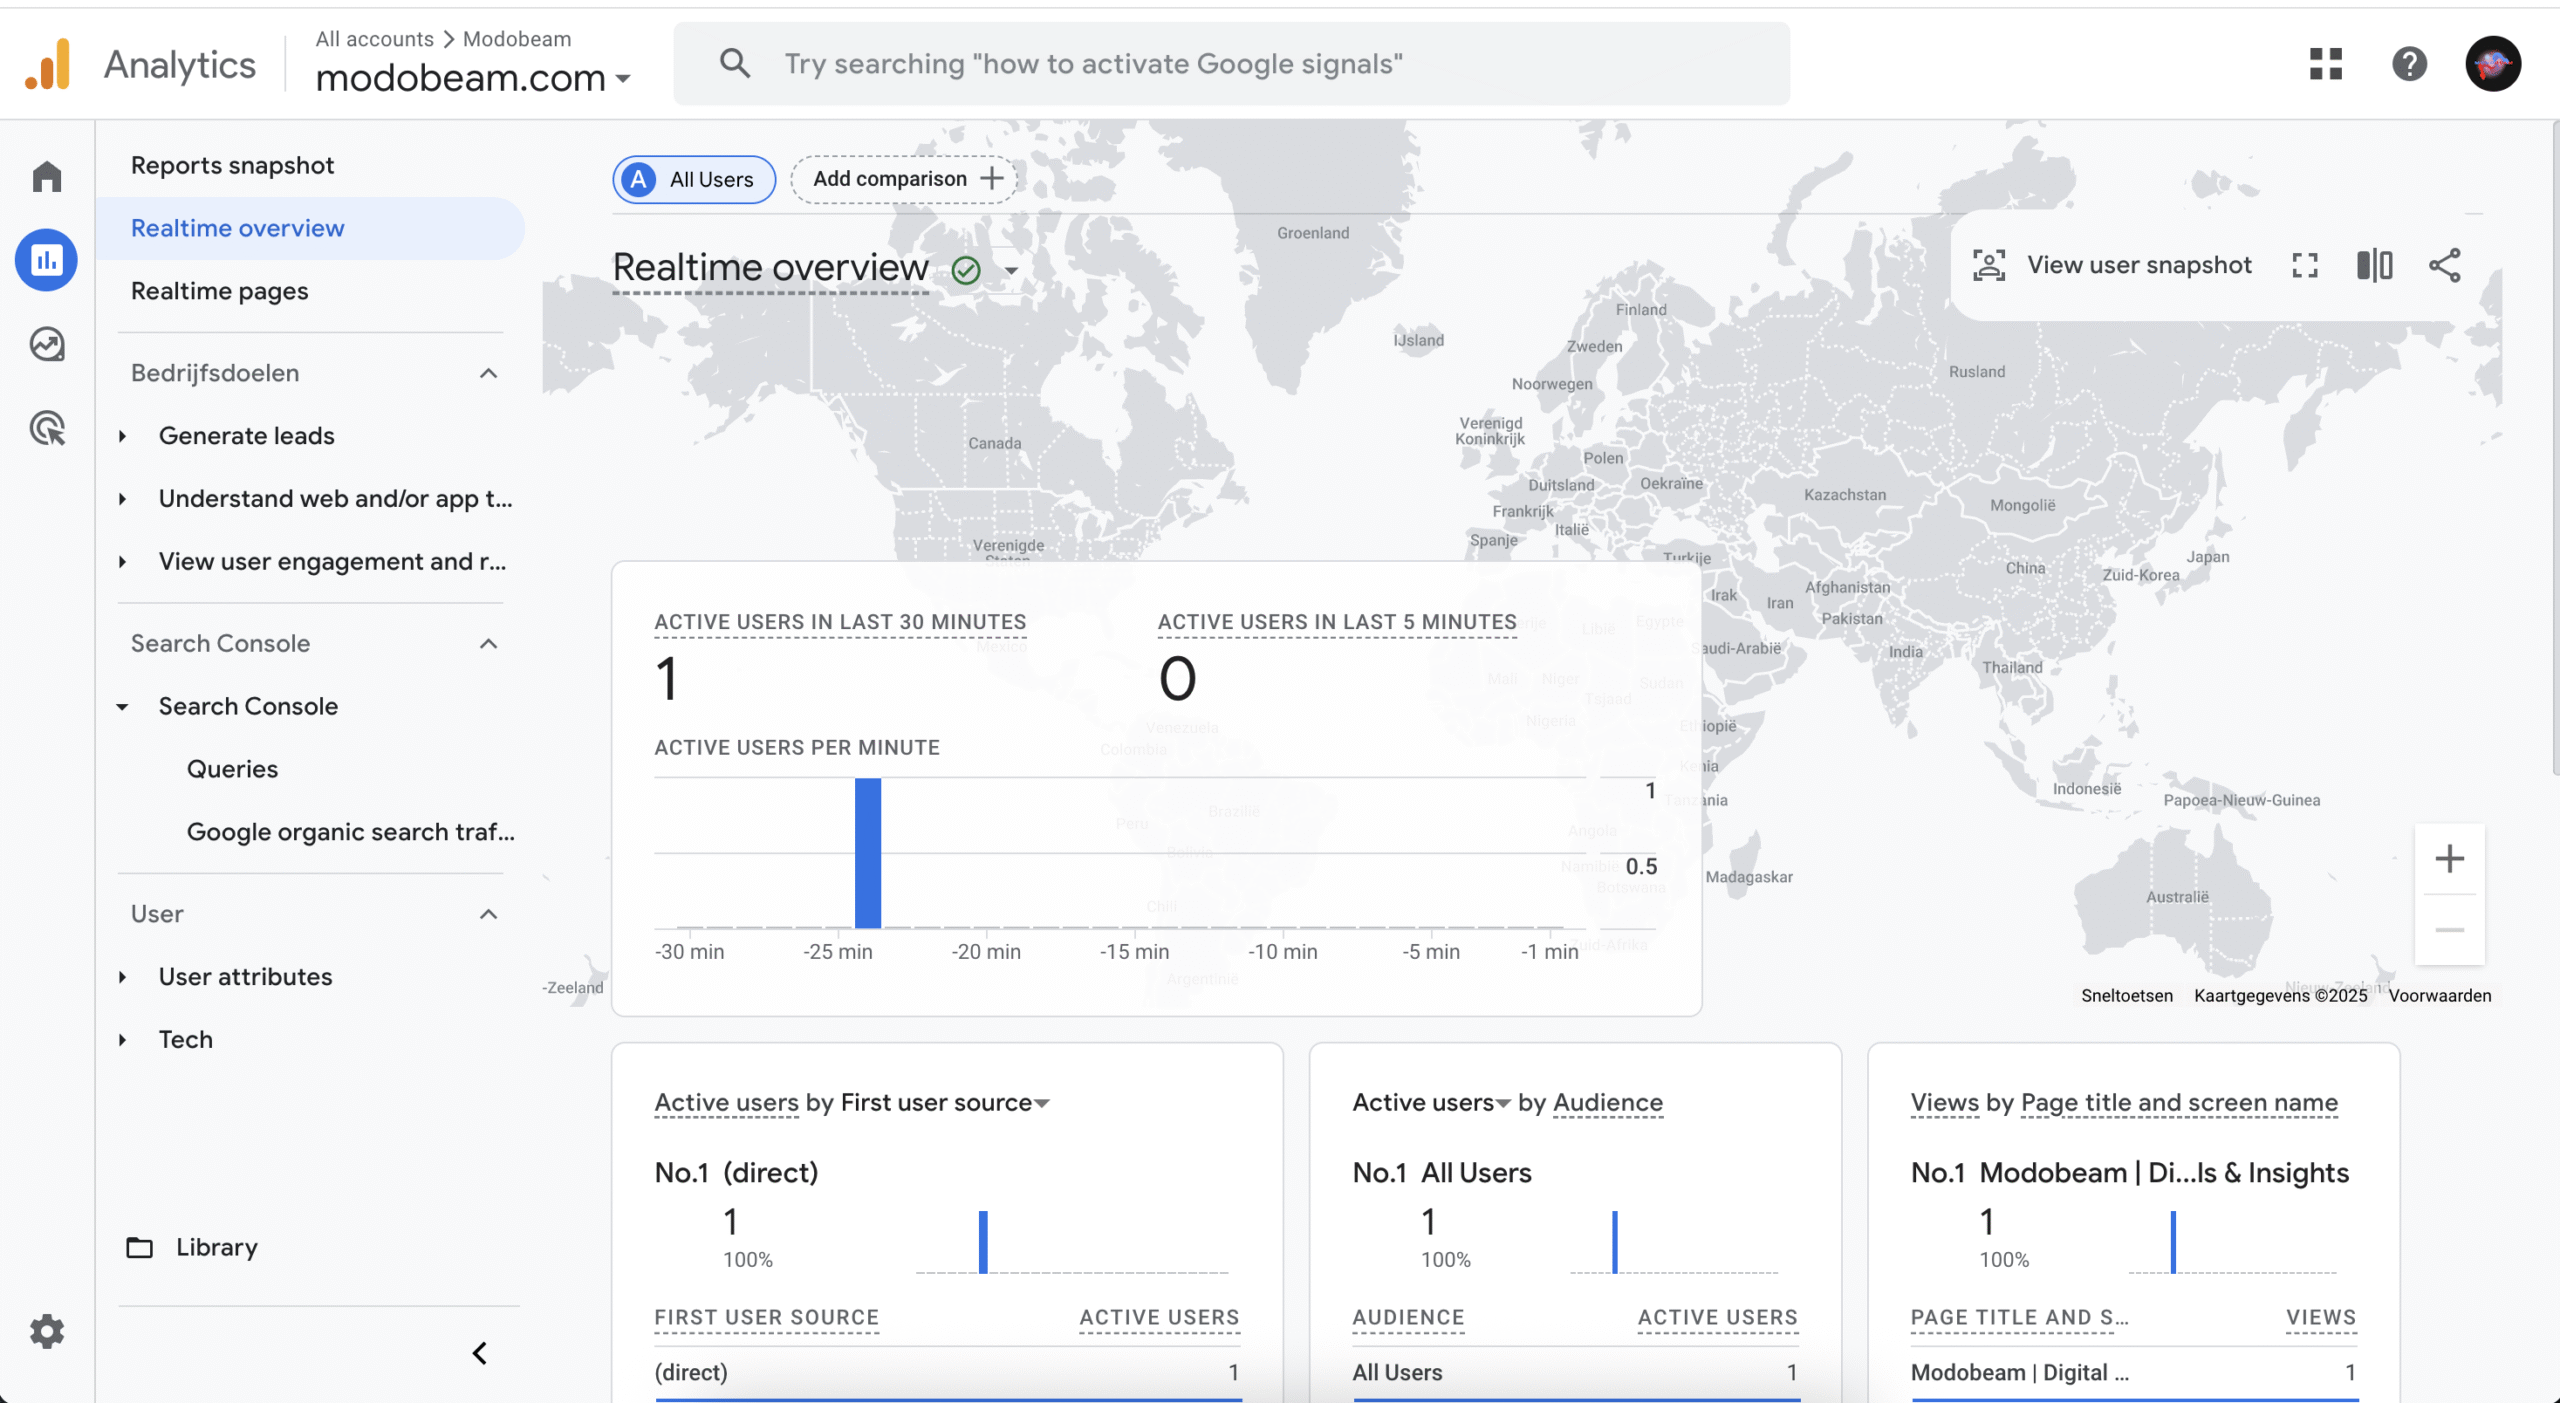
5. Real-Time Reports: Monitor Live Data
What You Can Do: Real-time reports provide insights into what’s happening on your website right now. You can use this data to:
- Track Campaign Performance: Monitor the effectiveness of live campaigns, promotions, or events. If you see a sudden spike in traffic, you can confirm whether your current campaign is working as expected.
- Test Immediate Changes: Make real-time adjustments based on data, such as tweaking a CTA button or changing messaging in an active campaign.
- Identify On-the-Spot Issues: If users are dropping off or having issues on specific pages, you can identify and resolve them quickly, potentially preventing further issues.
Example: If a product launch has just gone live, real-time reports can show you if there’s a surge in visitors. If the product page is underperforming, you can adjust on the fly, such as adding more details or adjusting pricing.
Conclusion: What to Do with Google Analytics Data
By understanding how to use Google Analytics reports, you unlock the full potential of your website data. These reports can inform your marketing decisions, help you optimize user experience, and ultimately drive conversions.
The key is to regularly monitor and act on the data you gather. By using these insights, you can fine-tune your marketing strategies, enhance your website’s usability, and boost your overall business performance. As you become more familiar with Google Analytics, you’ll be able to take advantage of advanced features like custom reports, segmenting audiences, and integrating with other platforms for even more valuable insights.